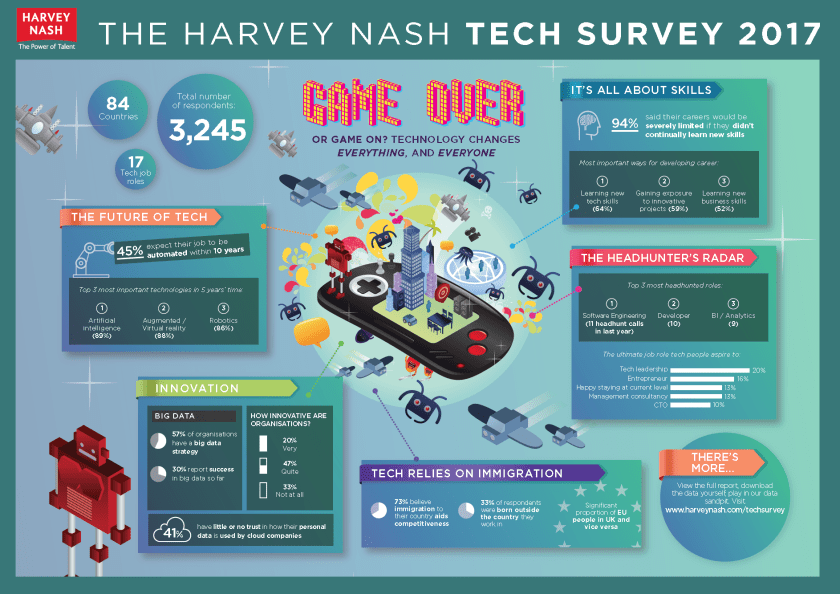
 Harvey Nash Tech Survey 2017
Game Over
Or Game On? Tech is changing everything, for everyone.
Harvey Nash Technology Survey – one of the largest studies of tech people in the world.
Key Highlights
Technology has always been about change.
But there is something about right now – as we progress through the 21st century – that suggests this change is happening at an even greater pace than ever.
Like with all change, not everything moves in the same direction; some things grow, some things recede, and some things morph into something else altogether.
In this year’s Harvey Nash Technology Survey 2017 we chart this changing tech environment, and how a unique combination of growth in cloud, AI and big data is beginning to affect everything, from the tech landscape to tech careers themselves.

Key highlights include:
Game on?
Technology: Artificial intelligence seen as biggest growth area – 24% of respondents see it as important now, jumping to 89% in 5 years’ time. Augmented / Virtual Reality and Robotics, as well as Internet of Things, Cloud and Big Data also highly influential.
Careers: Continually updating skills is seen as – by far – the most important focus. This is more than just formal training, learning needs to be part of a tech professional’s DNA. Software engineers top the table for in-demand job roles. Skills in development and analytics are seen as the ‘hottest’ skills to learn right now.
Organisations: The winners are the innovators. But that’s easier said than done with only 20% of organisations being ‘truly’ innovative. 58% of organisations are adopting agile to improve innovation abilities. Google remains the dominant tech brand; far ahead of Apple and Microsoft, but its lead is diminishing and Amazon is growing in influence as it expands into more markets.
Game over?
Technology: Spare a thought for mainframes, which are expected to see the biggest decline in influence. But reports of their death are (very) premature.
Careers: 45% of you expect your jobs to be automated within 10 years. Testing, Operations and BI experts are most concerned; Programme Managers, CTOs and Software Engineers least concerned. People who don’t continually develop their skills will fall behind. The winners are the innovators.
Organisations: 41% have little or no trust in how third parties use their data. The battleground for the future will be trust, not functionality. Organisations that don’t gain the trust of users, will eventually fail.
This year’s Technology Survey paints an exciting picture of a tech sector in positive flux. We hope you enjoy reading it and find it useful in your career and business planning.
Albert Ellis, CEO, Harvey Nash Plc.
Game Over
Or Game On? Tech is changing everything, for everyone.
Harvey Nash Technology Survey – one of the largest studies of tech people in the world.
The Full Report
Key highlights from the research
What did you say?
The Survey summarised in 100 words
AI sees big growth, Mainframe sees big decline

What is most evident from this chart is the rise of AI; whilst relatively few companies are making significant use of it now, by 2022 respondents expect it to be important in almost nine in ten organisations, leaping from #8 in our chart to #1.
That’s a big rise, and reflects a growing confidence in the tech community that AI, above anything else, is the growth area. In fact almost half of tech people expect AI and automation to advance so much that they expect their own jobs to be made redundant.
It’s no surprise then that AI is one of the most commonly quoted hot skills that people are learning, as you’ll see elsewhere in this report.
Virtual and augmented reality also see big rises.
But spare a thought for mainframe, which is expected to move from position #1 to #9. That said, despite many announcing the death of mainframe it has remained remarkably resilient over the years. According to Gartner, of the 100 largest banks in the world, 92 continue to use mainframes.
Whilst there are around 60,000 Google searches a second, IBM mainframes run 1.1m transactions per second. Clearly there’s life in old mainframe beast yet.
Google remains the most influential tech company
What tech company will be most influential in five year’s time?
Without doubt it is Google that remains the pre-eminent global technology brand; far ahead of any of its nearest rivals.
Apple, a brand in the past that has captured the public’s attention on many occasions, this year sees its influence at its lowest ebb since we began tracking four years ago.
The only company that has shown some growth in influence is Amazon, which has continued to expand its products and service offering well beyond its traditional retailing roots – Amazon Web Services, for instance, is expected to generate over $10bn of revenue in the next year.
When we ran our first Harvey Nash Technology Survey in 2014 this was $3bn. Clearly they are doing something right.
It’s interesting that the two companies that make the most use of personal data – Google and Amazon – are the companies most dominant in the league table.
Elsewhere in this report we will see just how uncomfortable the tech community is with how personal data is being managed online; personal data and public trust will potentially become a defining factor in these companies’ future success.
It’s worth noting that in the free text comments of this question respondents also cited Facebook and Tesla as influential tech companies; which we will add next year as options.
ALMOST HALF OF PEOPLE WILL BE AFFECTED BY AUTOMATION
Within ten years, a significant part of my job that I currently perform will be automated
 Almost half of technologists believe their job role is going to change beyond recognition in the next ten years, and the consequences of this are quite profound.
It’s no wonder why skills development is so high on tech people’s agenda.
For the other half of people who expect to be unaffected – it’s worth remembering that anything up to half of your work colleagues will be machines in 2027!
Technology affects everything.
Testers are most concerned, Programme Managers least concerned
Within ten years, a significant part of my job that I currently perform will be automatedOf course the likelihood that your job could be ‘eaten by software’ changes depending on what job you perform.
It’s probably no surprise that 67% of testers think a considerable amount of their role could be automated within the next ten years. Automated testing tools are already on the market, so this change may come much quicker than automation in other roles.
Those in management roles are less likely to think a substantial part of their role could be automated, only 30% of the Programme Management community agree with this.
Automation of tech jobs is fundamentally going to change how tech teams are structured. Some roles will disappear, new ones will be created. And whilst the shape of the tech team in 2027 might be hard to predict, one thing is very clear: tech people will increasingly be expected to show the advantage of their ‘human side’.
Creativity, innovation, dealing with complexity, dealing with people will all be key skills.
Over half of organisations are implementing Big Data
To what extent is your organisation implementing Big Data analytics?


Is Big Data big?
Well, with 57% of organisations implementing it to at least some extent, Big Data is becoming increasingly important.
For many it is moving away being an ‘experiment’ into something much more core to their business; 21% say they are using it in a ‘strategic way’.
Big Data is helping companies understand their customers better
What purpose is your organisation using Big Data for?
The most popular application of Big Data is externally facing – understanding customers more.
This is, perhaps, not surprising – Big Data was born from the desire to make sense of vast amounts of structured and unstructured data coming from customer transactions and, increasingly, online behaviour.
What is more surprising is how ‘optimizing business processes’ also ranks as a highly preferred application of Big Data.
Increasingly organisations are turning what they are learning externally about customers, to internal use, helping them make sense of their own employees and processes.
So far, only three in ten organisations report success in Big Data
How successful has your organisation’s Big Data strategy been?
So we’ve established Big Data is big, but is it successful? Well on that question the answer is not clear.
Only three in ten organisations with a Big Data strategy are reporting success.
If we remove the proportion of respondents that feel it’s ‘Too early to tell’, that success rate goes up to 52%.
This still feels quite low, and suggests many organisations are struggling to make a success of it.
As one CTO commented: “I need to sort out my small data first before I can even start thinking about my big data!”
Truly innovative organisations are rare
How innovative would you say your current organisation is?
With only one in five respondents (20%) working for companies that are true innovators, and one in three (33%) saying they work for entirely un-innovative companies, it’s clear many organisations are finding it hard to evolve.
For some it can even be a diversion, “Slow down! Everything that is broken needs to be fixed before all this ‘innovation’ starts happening” remarked one respondent.
But our sister survey – the Harvey Nash / KPMG CIO Survey – points to the reason why innovation is so important: two-thirds of top tech leaders are either experiencing digital disruption right now, or expect to experience it in the next two years.
That’s a figure to dwell on. Put it another way, it suggests that if you don’t keep on changing and evolving, you will start to lose market share.
It is true that many of the ‘big bang’ moments – where a new digital disrupter destroys traditional players within a very short period – have passed.
But that doesn’t mean the progress of digital has stopped, and for the rest of companies there is a risk of ‘death by a thousand cuts’.
Agile – key to innovation
What tools is your organisation using to become more innovative?
So how are companies encouraging innovation?
Well adopting agile is by far the most popular method. But agile alone doesn’t create innovation, it merely oils the wheels.
The next most popular factor is having a culture of innovation. If you look at just those respondents representing companies that are ‘Very’ innovative, innovation being part of the culture becomes the #1 factor in how they are innovative, with 72% saying it’s key.
Interestingly, one of the longest established methods of encouraging innovation – the ‘suggestion box’ – is broadly equally as popular amongst ‘Very’ innovative companies as the survey population at large, suggesting that there is little correlation between their use and driving innovation.
Clearly then, having the right culture is more important than any other factor. The only challenge is that creating a new culture is much harder to do than, say, rolling out a new methodology or online suggestion form.
We asked respondents to offer their hints and tips for a more innovative culture. Here’s a selection of the best comments.
- Set a % (arbitrary) and say that % of next year’s income must come from something different than the current year’s.
- Allow your staff the freedom to fail when innovating.
- Accept that Innovation may come from outside the organisation. Building a culture open to the external world is vital.
- Build a diverse team, in both background and experience. If everyone is cast in the same mould then everyone will think the same, which is no good for innovation.
- Free up time of employees to study and work on any project that does not have to be billable right away. For me its 1 day a week of “study / innovation time”.
- Make it part of the culture. Formalize processes for innovation to exist.
- We have a weekly 1 question survey and you get the chance to suggest anything to improve working life. This can lead to great innovation.
- Investment in IT resources frees up time for great minds to focus time on brainstorming and discussing innovation. Overloaded workstreams are killing creativity and stifling innovative growth.
- You need a creative culture, this has to allow time to and space to think. Deadline and time driven service organisations cannot innovative very well.
Tech community overwhelmingly positive about immigration
Is the immigration of skilled tech talent critical to the competiveness of my country’s technology sector?The technology sector is overwhelmingly in favour of immigration.
This is perhaps not a surprise as so many people in tech are themselves immigrants; 33% of respondents to the Technology Survey were born outside the country they are currently working.
Singapore tops the chart for foreign tech people
% of tech people born outside the place they live
Those in Singapore seem more likely to have been born abroad; 88% of respondents based in Singapore were not born there.
This is followed by Hong Kong with 75% and Australia and Switzerland both with 66%.
From this, we can see that Asia Pacific in general is attracting an awful lot of technology talent that isn’t home grown.
BREXIT MAY CREATE SIGNIFICANT CHALLENGES
Where are migrant technologists coming from?
For each country where we had a statistically significant sample size we then looked into where the migrants came from.
It revealed some interesting insights. For instance Netherland’s tech immigrants are overwhelmingly from Europe (70%).
Australia’s immigrant tech population mostly (and unsurprisingly, given its proximity) comes from Asia (62%).
However the UK – about as far away from Australia as you can get – represents 19% of tech immigrants, illustrating the strong cultural connection between the two countries.
This chart also hints at some of significant challenges that the UK leaving the EU (Brexit) might create.
Almost four in ten tech immigrants into the UK are from Europe, equating to one in ten of the entire tech working population in the UK. Moreover, UK workers make up at least a fifth the tech immigrant workforce of Ireland and Germany.
If every one of these people went back to their place of birth tomorrow, many tech departments across Europe would fall apart. Governments will need to think very carefully as they begin the process of Brexit negotiations.
WHERE ARE THE WOMEN
Gender split of respondents
Where are all the women? Well, not in tech that’s for sure.
This year’s report reveals that 16% of respondents are women; not very different from the 13% who responded in 2013.
The pace of change is glacial and – at this rate – it will take decades before we reach 50/50.
That said there are a few causes of slight optimism.
Firstly our sister report – the CIO Survey – tells us that around three in ten organisations have some kind of diversity initiative in place, many of which are relatively new. This increasing focus on diversity is good news, and will undoubtedly have an impact in the future.
Secondly, that same survey reports that women in tech leadership roles is increasing, this year 9% of the CIO/VP respondents were women, an all-time high and up from 6% last year. One of the most important things we’ve found in promoting gender diversity is having role models; having more female CIOs will undoubtedly bring more women into the industry.
What are the underlying challenges of women in tech?
Well, one big challenge is with the number of women entering the industry. Many women outside the sector just don’t seem to find it attractive. As one (female) tech leader said at a recent Harvey Nash event, “The fact there are so few women might be a problem for the tech sector, but it isn’t for the women themselves – they are choosing to be successful elsewhere”.
It’s a fair thing to say, but it shouldn’t need to the case: every bit of research we conduct tells us women are just as happy and successful as men when they are in a tech career, so the onus is on the sector to really get the positive message out there.
We can’t think of a better paid, more rewarding and creative career than technology. We need to amplify this message.
Proportion of women across regions
Women respondents and regions
Judging by responses to this Survey, the U.S. and Canada are more successful at bringing women into the tech workforce.
Gen Y much more focussed on learning new skills
When it comes to career progression, the focus for Gen Y (people aged below 30) is to learn new technical skills.
This too is important for Gen X (people aged 30 or above), but not so strongly.
Gen Y less interested in CIO role, more interested in start-ups
When looking at the stats for Gen Y v Gen X’s career aspiration, you could be forgiven for thinking ‘where are the new CIOs going to come from?’ With just 3% of those under 30 aspiring to reach this role, it looks like the traditional role of the CIO may become extinct.
The good news is that a fifth (21%) are interested in another tech leadership role, maybe that’s an evolution of the CIO.
Another fifth (19%) of under 30 year olds are keen to own their own business and become an entrepreneur, the start-ups of the future.
Those over 30 are more likely to be happy staying at their current level, with 14% giving this answer compared to just 7% of those under 30.
Innovative and interesting projects are key to retaining Gen Y
When asked what one thing Gen Y and Gen X would change about their workplace, ‘work on more interesting projects’ came out on top for both generations.
That said it is interesting just how much emphasis Gen Y puts on this compared to Gen X, with 33% and 25% selecting this option respectively.
TECH PEOPLE DON’T TRUST THE CLOUD
To what extent do you trust third parties to use your data in an appropriate way?
Those in North America and Canada are also more likely to have little to no trust with nearly half (48%) citing this as their answer.
APAC being slightly more trusting with 11% responding ‘Great extent’ and 59% answering ‘Some extent’.
Architects and Software Engineers least likely to trust the cloud
To what extent do you trust third parties to use your data in an appropriate way?
Those working in architecture roles are also more likely to not trust third parties with their data, 53% didn’t have trust.
9% of infrastructure managers, C-level and those in BI or Analytics trusted third parties to a great extent, the highest when we analysed the data by job title.
The older you get, the less you trust the cloud
To what extent do you trust third parties to use your data in an appropriate way? Great extent v age
There is a definite downward trend when we look at the data of those that trust third parties to a great or some extent by age. It seems the older respondents get, the less likely they are to trust third parties.
A lot can be said about that; whether it be that they’ve seen more instances of data being leaked, have already had data about themselves leaked or maybe they are just more cynical in general about third parties holding their data.
Those that work in Government are more likely to have little or no trust in these third parties, with nearly half (49 per cent) responding in this way.
So if you’re a male, Architect from North America over 30 working in Government, you are more likely to have little or no trust in third parties with your personal data…
Learning new skills is a top priority
Agree or disagree? My career would be severely limited if I didn’t continually teach myself new skills
Given just how quickly the tech sector moves it’s unsurprising that developing new skills is a priority for almost everyone in tech. And it doesn’t matter what job role – Business Analysts are just as likely to be keen on learning new skills as, say, Helpdesk analysts.
Also it doesn’t matter how old you are or – by implication – how much you might already know. Tech people in their 40s, 50s and 60s score just as highly in their desire for new skills; 9 in 10 are continuing to teach themselves new skills.
Tech people aspire to join start-ups and have tech leadership roles
What is the ultimate role you aspire to?
What is striking here is just how many tech experts see their career destination as entrepreneur; the second most popular option.
As recruiters, entrepreneurship is something we see increasingly often in the tech sector as more and more industries become affected by digital.
Of course for some it doesn’t turn out to be the ultimate career destination they originally envisaged – many start-ups are destined to fail – however the combination of technical skills and innovative thinking often make tech entrepreneurs strong candidates in corporations increasingly hungry to innovate.
It is also encouraging that 1 in 12 tech people ultimately see themselves as CEOs.
Analytics remains a hot skill
What is the hottest skill to learn right now?

We threw all the responses to this free text question into a word cloud. What’s clear is that a lot of people saw data and data analytical skills as being hot (that category includes phrases like ‘data science’, ‘big data’, ‘data analysis’ etc.)
Next down the list of hot skills automation and machine learning make an appearance, so too do DevOps and IoT.
It’s interesting that phrases like ‘coding’, ‘programming’ and ‘development’ make it to the chart rather than any particular development language; re-affirming that development is a skill that is continually in demand.
Learning new skills – the key to career development
What are the most important things you are doing right now, or plan to do soon, to develop your career? (select top 1 or 2)
‘Gaining exposure to innovative projects’ sits close to the top of the desires for career development, it’s not enough to be skilled, tech people are looking to apply those skills in new ways. But what sits at the very top is learning new skills, in line with the tech community’s desire to develop themselves.
Interestingly, gaining formal qualifications is not seen as so valuable to career development. Even in the more technical roles like security, operations or DB admin, gaining formal qualifications still sits close to the bottom of the table.
Who’s being headhunted the most?
How many qualified approaches have you had from headhunters in the last year?At the top of the ‘in demand’ table sits Software Engineer and Developers.
It appears that despite recent trends to outsource / offshore development and the increasing use of cloud based solutions that often require less bespoke development, these roles remain key. With organisations increasingly looking to innovate, the need for engineers and developers who are ‘close to home’ and focused on creating unique, bespoke software, has never been higher.
At the bottom of the table sits roles like Architects, Testers, Ops and CIO/CTO. These roles aren’t quite as unpopular as it first appears; whilst it’s true there is less ‘demand’ for the roles, there is also less ‘supply’ of talent to them, so for many people the headhunt call may end up more successful.
Tech people want interesting projects more than anything
If you were to change one thing about your workplace, what would it be?
So what would tech people change about their job? By far the most popular option was to work on interesting and challenging projects, followed by a desire to have a stronger team around them.
What’s interesting here is just how unimportant the other options were. We were expecting more people to be very dissatisfied with their boss, and yet only one in seventeen selected that. We thought that maybe some tech people would feel their long hours were the biggest challenge for them; no, only one in twenty felt that.
What this chart shows, and this is also backed up by the thousands of interviews Harvey Nash conduct each year, is that tech people are driven by a desire for excellence in what they do.
They want challenging projects, they want to work with challenging people, and they want to see the results of their work make a difference.
If that means long hours, a lack of training, or a difficult boss, tech people can live with this, as long as they feel they have been challenged.
Recruiters are too focussed on technical skills
Agree or disagree? Recruiters are too focused on assessing technical skills, and overlook good people as a result
Sometimes you ask a question half knowing what the answer might be. And this is one such question. But what we didn’t expect was just how strong the feeling would be: seven in ten tech people feel the sector is too focussed on tick boxing technology skills.
The topic of tech skills is a challenge for the sector. Many employers would be happy to hire someone who had the right personal attributes, but do not have the specific technical skills, and then train them.
This is especially the case in areas like development or analytics where demand far outstrips supply and salaries and contract rates of experienced people are eye wateringly high. But sometimes this aspiration is difficult to achieve. For a start defining exactly what the right ‘personal attributes’ are, and then finding a way to assess people on these attributes, can be a challenge.
If you are looking for a team player who’s technically adept and a quick learner, what exactly do you look for in a CV / resume to differentiate one person from thousands of others?
Also, training can be difficult, especially for smaller companies, or where project timescales need people who can ‘hit the ground running’.
It’s no wonder that whilst many employers aspire to recruiting people based on personality, in practice it is often the case they revert to hiring based on technical skills.
Out of interest, Harvey Nash’s own solution to the challenge of cross training is our recently launched service line in Europe: Talent-IT.
We take non-tech graduates, cross train them in tech skills, and then place them on a contract basis at clients’ sites. At the end of the year the client has the option of hiring these people permanently at no fee. It works.
But of course that’s only one way of doing it.
Permanent salary breakdown
| Count | Average | Lower quartile | Median | Upper quartile | |
| Architect | 74 | $109,324 | $85,000 | $110,000 | $130,000 |
| Business Intelligence / Analytics | 47 | $85,851 | $45,000 | $75,000 | $120,000 |
| Business Analyst | 65 | $72,231 | $45,000 | $65,000 | $95,000 |
| CIO, CTO or VP of IT | 130 | $136,654 | $87,500 | $130,000 | $150,000 |
| Database Admin/Engineer | 23 | $68,696 | $45,000 | $65,000 | $75,000 |
| Developer | 78 | $64,038 | $27,500 | $55,000 | $82,500 |
| Development Manager / Team Leader | 76 | $101,645 | $72,500 | $95,000 | $130,000 |
| Helpdesk | 26 | $32,308 | $15,000 | $25,000 | $35,000 |
| Infrastructure Analyst | 28 | $61,786 | $35,000 | $55,000 | $85,000 |
| Infrastructure Manager / Team Leader | 70 | $88,143 | $55,000 | $75,000 | $110,000 |
| Operations Analyst | 75 | $57,067 | $35,000 | $45,000 | $75,000 |
| Programme Manager | 64 | $114,531 | $75,000 | $95,000 | $150,000 |
| Project Manager | 100 | $76,250 | $52,500 | $65,000 | $95,000 |
| Quality Assurance | 30 | $73,667 | $55,000 | $75,000 | $92,500 |
| Software Engineer | 99 | $80,657 | $35,000 | $65,000 | $110,000 |
| Tester | 32 | $61,250 | $42,500 | $55,000 | $85,000 |
| Design/UX/UI | 18 | $72,500 | $47,500 | $65,000 | $85,000 |
Contract salary breakdown
| Count | Average | Lower quartile | Median | Upper quartile | |
| Architect | 44 | $801.14 | $550 | $750 | $950 |
| Business Intelligence / Analytics | 27 | $509.26 | $350 | $450 | $600 |
| Business Analyst | 60 | $610 | $450 | $550 | $775 |
| CIO, CTO or VP of IT | 44 | $984.10 | $650 | $750 | $1250 |
| Developer | 69 | $438.41 | $350 | $450 | $550 |
| Development Manager / Team Leader | 25 | $598 | $450 | $550 | $750 |
| Helpdesk | 18 | $172.22 | $75 | $150 | $225 |
| Infrastructure Manager / Team Leader | 35 | $560 | $350 | $450 | $600 |
| IT Operations | 35 | $332.86 | $150 | $250 | $550 |
| Programme Manager | 63 | $813.49 | $600 | $750 | $950 |
| Project Manager | 100 | $599 | $450 | $550 | $675 |
| Software Engineer | 54 | $459.26 | $275 | $450 | $650 |
| Tester | 32 | $431.25 | $325 | $450 | $550 |
You must be logged in to post a comment.